Service blueprinting is a way to draw one service on a single diagram: what the customer does, what your people do in front of them, what happens out of sight, and which systems and processes make it all work. You build it to find where a service breaks, who owns each step, and what to fix first. This guide covers the parts of a blueprint, a step-by-step method, an example you can adapt, and how a blueprint differs from a journey map or a process map.
TL;DR
- A service blueprint is a diagram that links customer actions, frontstage and backstage work, and support processes to the touchpoints in one customer journey.
- Three horizontal lines separate the layers: interaction, visibility and internal interaction. They show who sees what and where handoffs happen.
- Build it in order: set the scenario, map the customer, map frontstage and backstage actions, then support processes and evidence.
- A journey map shows the customer’s experience. A blueprint adds the organization’s delivery of it underneath.
- Blueprints pay off most where several departments touch one customer outcome, such as onboarding, renewals or invoicing.
Table of Contents
- What a service blueprint is
- What a service blueprint contains
- When service blueprinting is worth the effort
- How to create a service blueprint, step by step
- A worked example: SaaS customer onboarding
- Adapting a service blueprint template
- Service blueprint vs journey map vs process map
- Where a blueprint stops and AI begins
- Our perspective
- How NordOps Consulting can help
- FAQ
- Sources
What a service blueprint is
A service blueprint is a diagram that visualizes the relationships between service components, meaning people, props (physical or digital evidence) and processes, that are directly tied to touchpoints in a specific customer journey. That is the definition used by Nielsen Norman Group, and the idea is consistent across the field.
The Government of Ontario describes it as a visual schematic that includes the perspectives of the user, the service provider and other important groups, including visible touchpoints and the behind-the-scenes interactions the provider knows about.
The point is that a customer only ever sees part of a service. A late invoice, a wrong access level or a slow reply usually starts in a handoff the customer cannot see. A blueprint puts that hidden work on the same page as the customer’s experience, so you can trace a symptom to its cause.
What a service blueprint contains
A blueprint has rows (often called swimlanes) and lines. Reading from top to bottom, the typical rows are:
- Evidence. The props and places the customer and staff encounter: emails, screens, contracts, dashboards, a portal.
- Customer actions. The steps, choices and interactions the customer performs to reach a goal. These can come from research or from an existing customer journey map.
- Frontstage actions. What your people or systems do where the customer can see it.
- Backstage actions. What happens out of sight to make the frontstage possible.
- Support processes. The internal systems, rules and services behind both.
ACM Interactions describes the same five swimlanes and notes optional extras such as time, quality measures and the emotional journey.
The three lines
Three lines divide those rows, and they carry most of the diagnostic value:
| Line | Sits between | What it shows |
|---|---|---|
| Line of interaction | Customer actions and frontstage | Every point where customer and organization meet |
| Line of visibility | Frontstage and backstage | What the customer can and cannot see |
| Line of internal interaction | Backstage and support processes | Handoffs between internal teams and systems |
Ontario’s guidance uses the same three dividing lines. The 18F team at the US General Services Administration uses a simpler version with four rows: user steps, frontstage actions, backstage actions and support processes. Start simple. You can add rows later.
Layers, lanes and links
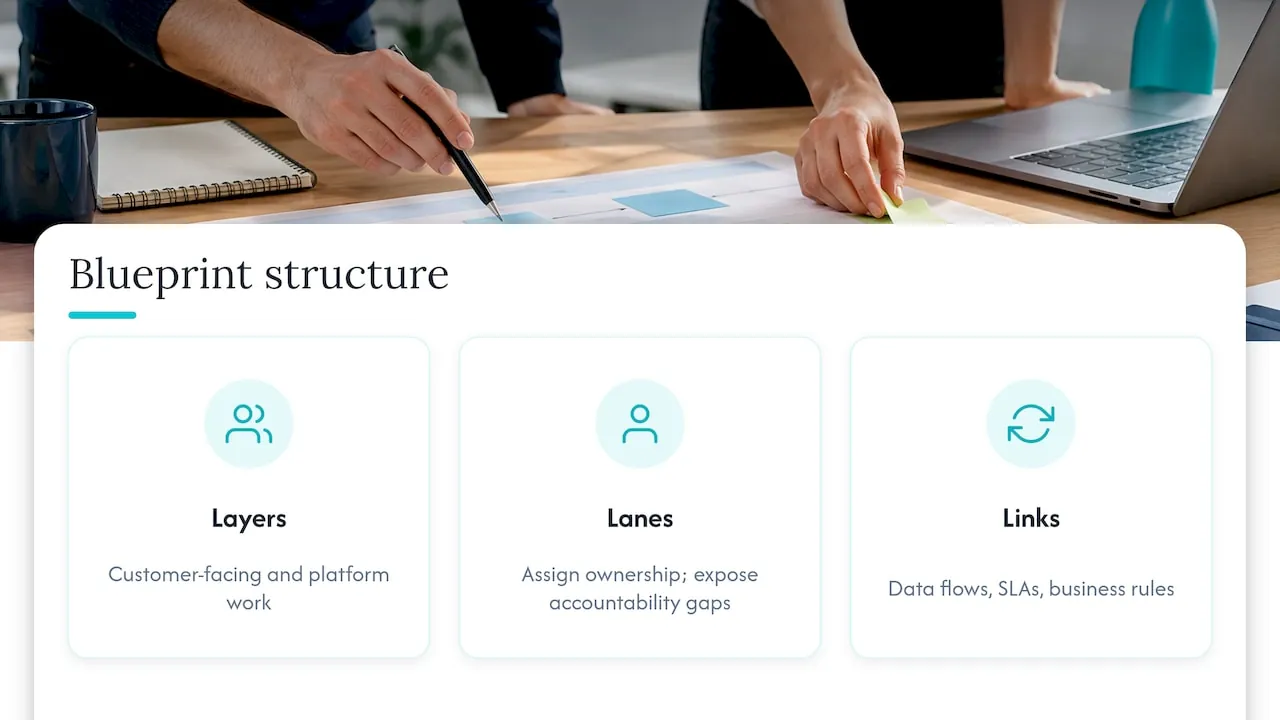
One practitioner framing helps in operations work: layers separate customer-facing work from enabling platforms, lanes assign ownership so accountability gaps show up, and links show dependencies such as data flows, SLAs and business rules. If a step has no owner, or an arrow depends on data that lives in someone’s spreadsheet, the blueprint makes that visible.
When service blueprinting is worth the effort
NN/g says blueprinting is an ideal approach for experiences that are omnichannel, involve multiple touchpoints or need coordination across departments. It also notes that the exercise itself builds communication across teams and helps people see their contribution to the end-to-end experience.
In a B2B SaaS company, good candidates are:
- Customer onboarding, where Sales, Customer Success, Support and Finance all touch the same account.
- Renewals and expansions, which depend on usage data, contract terms and billing.
- Quote-to-cash, where a signed deal must become a provisioned account and a correct invoice.
- Access and permission changes, which cross product, security and support.
A blueprint is less useful for a task one person does alone in one tool. A simple checklist is enough there.
How to create a service blueprint, step by step
NN/g’s five-step approach is find support, define the goal, gather research, map in low fidelity, then refine and distribute. Its digital template workflow adds the mechanics. Combined, the process looks like this.
1. Choose one scenario and one customer
Pick a single journey for a single type of customer, for example “a new mid-market customer goes from signed contract to first successful use.” Record a title, date and version, and decide how granular you want to be. Blueprints that try to cover every scenario become unreadable.
2. Get the right people involved
Blueprinting spans departments, so you need someone with authority across them. Without it, the diagram becomes one team’s opinion of another team’s work.
3. Gather internal research
NN/g notes that blueprinting relies mainly on internal research, unlike journey mapping, and recommends combining methods such as employee interviews, direct observation and contextual inquiry. Ask people what they actually do, not what the process document says.
4. Map the customer’s actions
Write the customer’s steps first, in chronological order and in present tense, as Ontario’s guidance advises. If you already have a journey map, use it as the starting point.
5. Map frontstage and backstage actions
For each customer step, add what your people or systems do in view and out of view. NN/g says these should come from real employee accounts, validated through internal research.
6. Add support processes and evidence
Under the backstage row, list the systems, rules and services each action depends on. Then work through the columns to note the props and places the customer meets along the way.
7. Mark the problems and refine
Circle handoffs without an owner, steps that depend on manual re-keying, and points where the customer waits. Start in low fidelity (sticky notes or a whiteboard), then clean it up for distribution once the team agrees it is accurate.
A worked example: SaaS customer onboarding
The example below is an illustration we built for this guide, not a real company’s blueprint. It shows how the rows connect.
| Row | Step 1: Contract signed | Step 2: Account set up | Step 3: First training | Step 4: First invoice |
|---|---|---|---|---|
| Evidence | Signed order form | Welcome email, login link | Calendar invite, shared guide | Invoice PDF |
| Customer actions | Signs, names an admin | Logs in, invites users | Attends session | Pays |
| Frontstage | Sales hands over | Customer Success confirms setup | CSM runs session | Finance sends invoice |
| Backstage | Deal data entered in CRM | Admin provisions access by hand | CSM checks usage data | Finance rebuilds plan details from the contract |
| Support processes | CRM fields, contract template | Identity tool, permission rules | Product analytics | Billing system, price list |
Reading across, the weak points appear quickly. Step 2 depends on a manual provisioning task with no clear owner. Step 4 depends on someone re-reading the contract because plan details in the CRM and in billing disagree. The customer experiences these as a slow start and a wrong invoice. The blueprint shows they are data and ownership problems behind the line of visibility.
Adapting a service blueprint template
Most templates, from whiteboard tools and from NN/g’s digital template, share the same grid. To make one fit your company:
- Rename the rows to your vocabulary. If your teams say “handover” and “provisioning,” use those words.
- Add a row for data. In software businesses, the system of record behind each step matters. Note which system holds the truth for each backstage action.
- Add an owner for every backstage and support cell. A named role or person, not a department.
- Add a time or cost row if you plan to prioritize. ACM Interactions lists time and quality measures as optional swimlanes.
- Keep one scenario per sheet. Version it, and date it.
Service blueprint vs journey map vs process map
These tools are related but answer different questions.
| Journey map | Service blueprint | Process map | |
|---|---|---|---|
| Main question | How does the customer experience this? | How does the organization deliver that experience? | How does work flow through a task or team? |
| Perspective | Customer | Customer and organization | Internal |
| Shows emotions | Yes | Optional | No |
| Shows backstage and systems | No | Yes | Often, but without the customer view |
NN/g says a journey map’s primary goal is to understand the end user, including thoughts and emotions, while a blueprint reflects the organization’s perspective. Smaply describes the blueprint as extending the journey map downward, with the journey map as the top layer and the blueprint as everything underneath.
A process map follows the flow of work inside a team or task. It does not tie each step back to what the customer sees. Use a process map when you need detail inside one backstage step, and a blueprint when you need to see how the steps connect to the customer.
Where a blueprint stops and AI begins
A finished blueprint is also the best input for deciding where automation or AI belongs. The backstage and support rows list the repetitive lookups, record updates and handoffs that cost time. They also show where AI does not belong: judgment calls on pricing exceptions, sensitive customer conversations, and decisions with legal or contractual weight should stay with a named person, with AI at most preparing information for them.
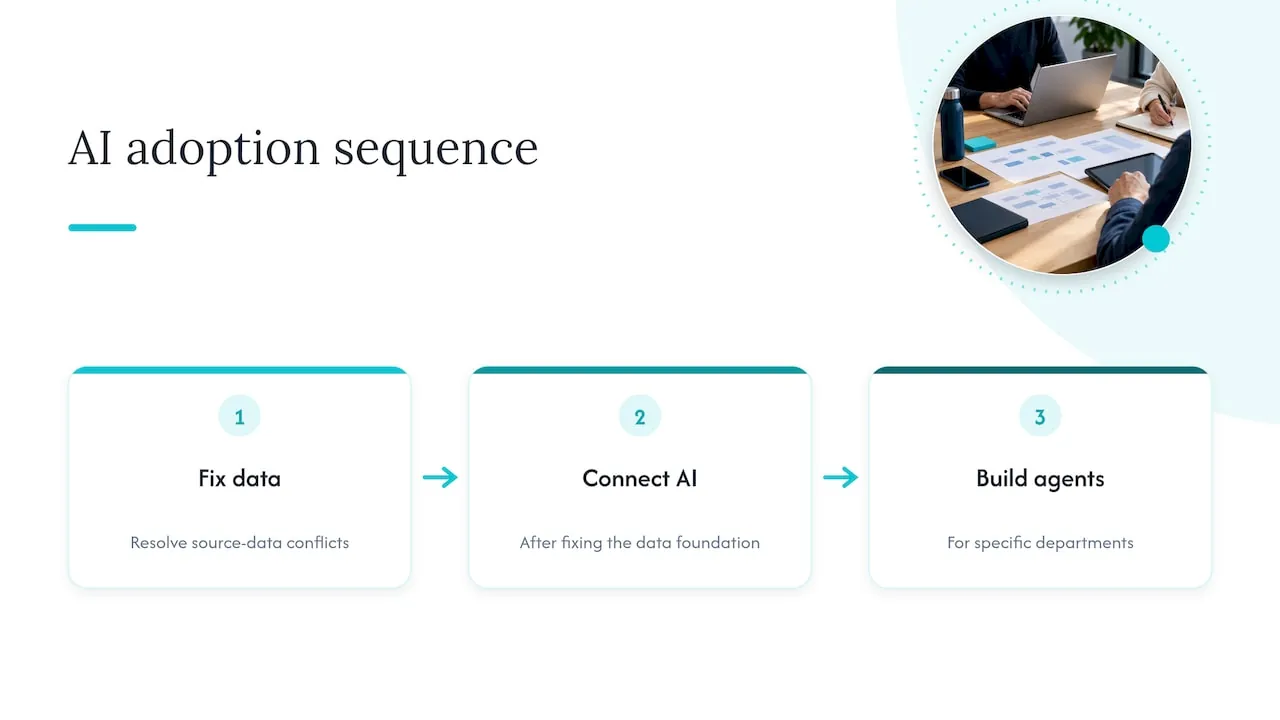
The order matters. If the CRM and finance data disagree, an AI assistant will read the disagreement and repeat it. Fix the data foundation first, then connect the AI layer, then build agents for specific departments. Our AI adoption method follows that sequence, one process at a time, starting with the most expensive one.
If you handle personal data in these flows, GDPR applies to how it is processed, and depending on your business, NIS2 and the EU AI Act may also be relevant. A blueprint helps you see which steps touch personal data and who can access it. It does not by itself make any process compliant, and it is not legal advice. Ask your legal counsel which obligations apply to you.
Our perspective
We use blueprints because AI in a growing SaaS company fails in the same place most services fail: at the handoffs nobody owns.
When a team tells us “AI isn’t working for us,” the cause is rarely the model. It is usually that the CRM says one thing, finance says another, and no one decides which is right. A blueprint makes that argument visible in an afternoon.
That is why we start with the data foundation, where CRM and finance data become the source of truth. Then we connect it to the AI assistant the company already uses. Only then do we build agents for Finance, Sales or Customer Success that your people can use in plain language, within permissions and with an audit trail.
We also say clearly where AI does not belong. If a step needs judgment, accountability or a conversation, a person should own it. The blueprint is where you decide that on paper before anyone builds anything.
Claus Nielsen
How NordOps Consulting can help
If your blueprint shows that AI is being used in several places but nobody owns it, that is the situation we work on. Our AI Readiness Assessment is available from €4,500 and gives you a structured view of where AI would pay in your operation and what your data needs first. For ongoing ownership, the Fractional Chief AI Officer is available from €1,500 per month.
Builds are priced at 30% of a first-year saving that is measured and proven, or at a fixed price agreed before work starts. You own what is built: source code, documentation and infrastructure transfer at handover. You can also start with a free 30-minute discovery call through our website.
FAQ
What is a service blueprint diagram?
It is a diagram that maps one customer journey alongside the work that delivers it. It shows customer actions, frontstage actions, backstage actions and support processes, separated by lines of interaction, visibility and internal interaction. It lets teams see how hidden work shapes what the customer experiences.
How do I design my own service blueprint?
Pick one scenario and one customer, then gather internal research from the people who do the work. Map customer actions first, add frontstage and backstage actions, then support processes and evidence. Begin in low fidelity and refine once the team agrees it is accurate.
Is a service blueprint the same as a journey map?
No. A journey map focuses on the customer’s experience, including thoughts and emotions. A blueprint extends it with the organization’s frontstage, backstage and support work. Many teams build the journey map first and use it as the top of the blueprint.
How detailed should a service blueprint be?
Detailed enough to show who owns each step and which system each step depends on, and no more. Decide granularity at the start, keep one scenario per diagram, and add detail only where you find a problem worth fixing.
Sources
- Service Blueprints: Definition, NN/g
- Service Blueprinting FAQ, NN/g
- Service Blueprinting in Practice: Who, When, What, NN/g
- 5 Steps to Service Blueprinting, NN/g
- Service Blueprinting: A Digital Template, NN/g
- Service blueprints, Government of Ontario
- Service blueprint, 18F Guides
- Service blueprints: Laying the foundation, ACM Interactions
- How to Build a Blueprint: Layers, Lanes, and Links, Customer Science
- Journey Map vs Service Blueprint: How They Relate, Smaply