Customer health scoring turns signals from your CRM, product, support desk and billing into one number per account, so your team knows which customers to call this week. It only works if the data underneath is agreed and trusted. The scoring formula is the easy part. A score built on conflicting CRM and finance records produces confident, wrong answers. At NordOps Consulting we build the data foundation first, then the AI layer, then the agents your Customer Success team uses.
This guide is for leaders of B2B SaaS companies with roughly 20 to 200 people. It covers which metrics to use, how to weight them, a worked calculation, how to check that the score predicts churn, and where AI should and should not be involved.
TL;DR
- A health score is a composite of several signals, such as usage, engagement, support and renewal behavior. No single metric is enough.
- Start with five categories: usage (including trend), adoption, support, relationship and commercial. Keep weights coarse and write them down.
- Use three bands, for example Healthy 70 to 100, At risk 40 to 69 and Critical 0 to 39, and attach one defined action to each band.
- Check the score against accounts that already churned. If it was green 90 days before they left, it is describing the present, not predicting the future.
- Fix the data first. Then let AI read the score and prepare actions. People still own the weights and the decisions.
Table of Contents
- What a customer health score is for
- Which customer health metrics to track
- How to calculate a customer health score
- Why most health scores fail
- Validate the score against accounts that already churned
- When a statistical model makes sense
- Where AI belongs in health scoring, and where it does not
- Privacy and regulation: what to keep in mind
- How to roll it out in a growing SaaS company
- Our perspective
- How NordOps Consulting can help
- FAQ
- Sources
What a customer health score is for
A customer health score estimates how likely an account is to renew, expand or churn. It does this by combining signals from different systems into a single, comparable view. HubSpot’s guide notes that what counts as “healthy” differs by business model, product complexity, customer segment and lifecycle stage. A 15-seat account in onboarding and a 400-seat account in year three should not be judged by the same yardstick.
The score has two jobs:
- Prioritize attention. A Customer Success team of four cannot review 300 accounts every week. The score sorts the list.
- Give early warning. A drop in score should reach someone while there is still time to act, ideally months before the renewal date.
If the score does neither, it is a dashboard decoration. Most scores fail because of the inputs, not the math.
Which customer health metrics to track
Start with five categories of signal. The ranges below are starting weights published by ZoomInfo, and they are a place to begin, not a rule.
| Category | Typical signals | Starting weight |
|---|---|---|
| Product usage | Usage frequency, active users per licensed seat, feature usage | 30 to 40% |
| Relationship | Champion engaged, executive sponsor active, number of stakeholders, people changes | 20% |
| Support | Ticket volume and severity, escalations, 90-day trend | 10 to 15% |
| Sentiment | NPS, CSAT, in-app surveys, CSM judgment | 10 to 15% |
| Billing and commercial | Payment timeliness, downgrade requests, license growth | 10 to 15% |
Three points matter more than the exact percentages.
Measure trend, not only level
Basedash argues that for most SaaS products the most predictive category is usage trend rather than usage level. An account with high usage that dropped 40 percent this month is often a bigger risk than a steady, low-usage account. Store a 30-day and a 90-day comparison next to each point-in-time count.
Do not let product data hide relationship risk
Product data cannot see that your champion left last month. ZoomInfo describes relationship as the blind spot in most health scores and links the gap to a lot of surprise churn. Your CRM should hold the champion, the executive sponsor and the date each contact was last confirmed. If it does not, the relationship category is guesswork.
Mix leading and lagging indicators
HubSpot’s guide describes high-performing teams as balancing leading indicators like usage and engagement with lagging ones like renewal outcomes and feedback. Leading signals warn you. Lagging signals confirm what happened. A score made only of lagging signals tells you about churn after it is too late.
Keep the list short. Six to ten metrics is a workable range: fewer leaves blind spots, and more makes it hard to see why a score moved.
How to calculate a customer health score
The calculation is a weighted sum. Each metric is converted to a 0 to 100 value, multiplied by its weight, and the results are added up.
A defensible starting point for B2B SaaS, published by Basedash, is:
- Product usage, including trend: 35%
- Adoption breadth and depth: 25%
- Support health: 15%
- Relationship and sentiment: 15%
- Commercial: 10%
The same source suggests these bands: Healthy 70 to 100, At risk 40 to 69, Critical 0 to 39.
A worked example
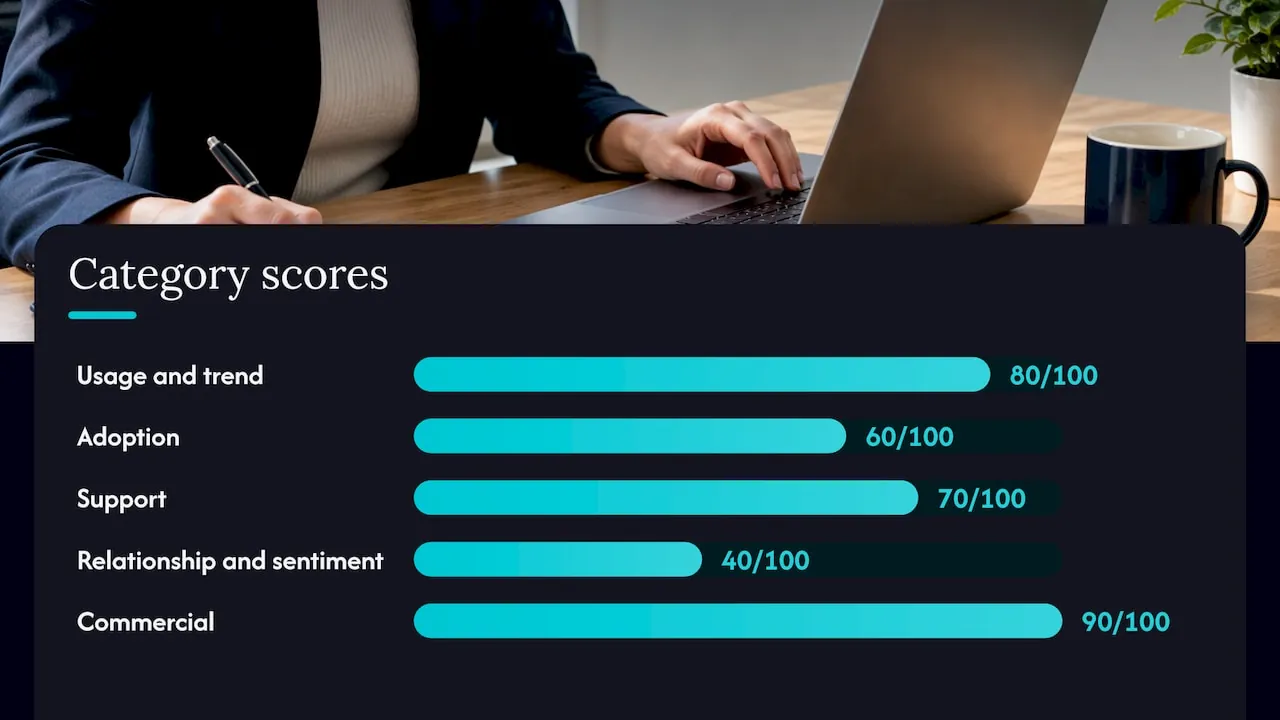
This is an illustrative account, not a real customer. Each category has already been converted to a 0 to 100 value.
| Category | Value | Weight | Contribution |
|---|---|---|---|
| Usage and trend | 80 | 0.35 | 28.0 |
| Adoption | 60 | 0.25 | 15.0 |
| Support | 70 | 0.15 | 10.5 |
| Relationship and sentiment | 40 | 0.15 | 6.0 |
| Commercial | 90 | 0.10 | 9.0 |
| Total | 68.5 |
The account scores 68.5, which is At risk. Usage looks strong and payments are on time. The drag comes from relationship and adoption: the executive sponsor has gone quiet and only part of the product is used. A usage-only score would have called this account safe.
That is why the next step matters. The band should trigger a specific action, such as an executive check-in and an adoption plan for the unused modules. A number with no attached action does not change what your team does on Monday.
Keep the weights coarse
Precise weights imply confidence the data may not support. Round to the nearest five percent, write down why each weight is what it is, and expect to change them as the product and your customer mix change. Early in the customer journey, onboarding progress deserves more weight. For mature accounts, depth of use and outcomes matter more.
Use separate profiles by segment
A single score for every account blurs important differences. At minimum, separate onboarding accounts from established ones, and small accounts from large ones. “Healthy” in onboarding means on track to go live. “Healthy” in year three means value is realized and renewal is likely.
Why most health scores fail
Most failures come from the plumbing, not from the formula.
- The same customer has different numbers in different systems. The CRM says 80 seats, billing says 65, the product says 41 active. Which one feeds the score?
- Fields are empty or stale. The sponsor field was filled in at the sale and never updated.
- Nobody owns the definition. Customer Success, Sales and Finance each have their own idea of an at-risk account.
- The score is built once and never checked. The product changes, the customer base changes, and the score quietly stops predicting anything.
The first two are data problems. In our work, CRM and finance data become the source of truth that everything else reads, with a Processor that turns the data in the surrounding systems into one agreed version. Until that exists, a more sophisticated score only produces more sophisticated mistakes.
Validate the score against accounts that already churned
Validation is the step most teams skip. It takes an afternoon and tells you whether you can trust the score.
- Look backward. Take the accounts that churned in the last twelve months. Reconstruct what the score would have said 90 days before they left. If most were green or yellow, the score describes the present rather than anticipating the future.
- Look the other way. Of all accounts that would have been red 90 days ago, how many actually churned? A score that marks a large share of the base red will catch most churn and still be useless, because it cannot prioritize.
- Track precision at the top. Of the accounts the score flagged as most at risk, how many were right? That is the number worth watching.
- Repeat quarterly. Segments, product and buyers change, and an unchecked score decays.
Two tests for each signal help here: does it move before the outcome rather than alongside it, and can someone do something different because of it? A signal that fails either test comes out.
When a statistical model makes sense
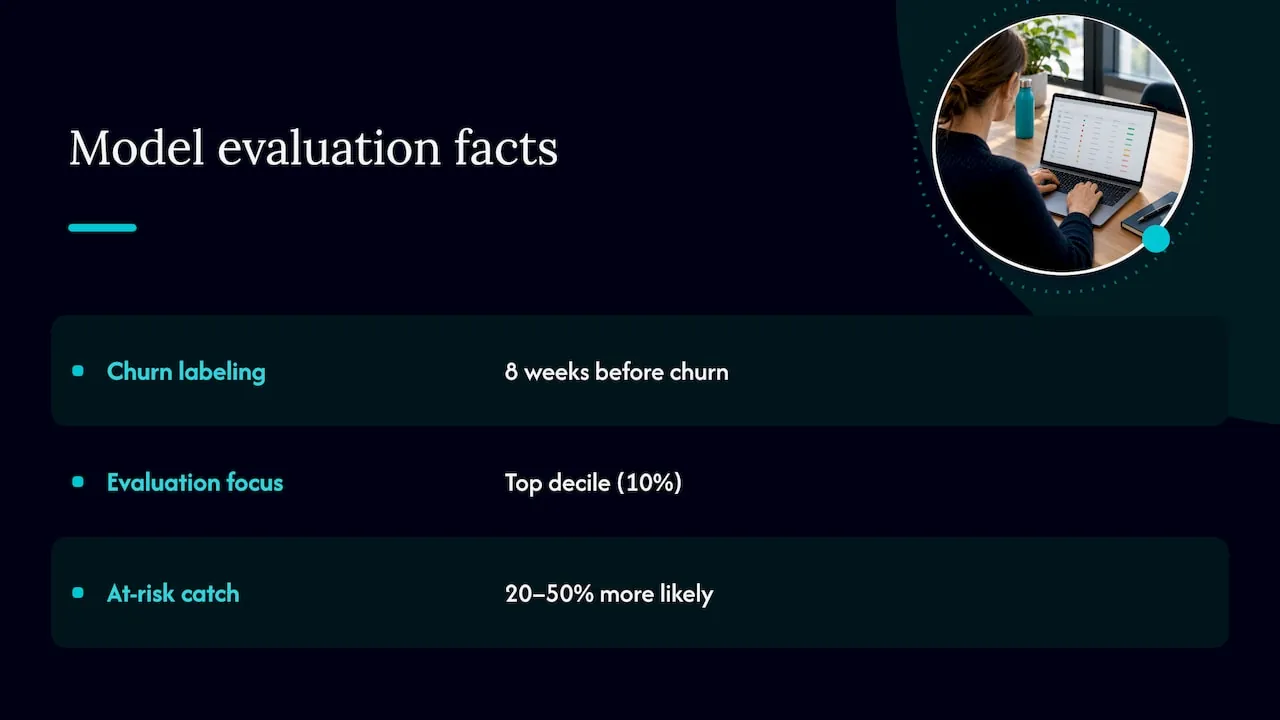
Weighted scorecards are a good place to start, but some companies move to a trained model. Asana’s data science team rebuilt its account health score as a classifier trained on historical churn data, because its original score was a lagging indicator and Customer Success needed advance notice. The team reported the new model was 20 to 50 percent more likely to catch at-risk accounts than the earlier score, depending on account type.
Two details from that work are useful for a company of any size. They labeled accounts as churned eight weeks before the actual churn date, so the model learned from early signals. They also judged it by the top decile of accounts, because 10 percent of customers roughly matched how many accounts their team could actually reach in time.
For a company with 20 to 200 people and a few hundred accounts, the history to train a reliable model is often thin. A transparent weighted score, validated every quarter, is usually the better first step. Move to a model when you have enough churn events and clean data to support it.
Where AI belongs in health scoring, and where it does not
AI is useful in the work around the score. It is a poor owner of the score itself.
Where AI pays:
- Pulling data on request. A Customer Success manager asks in plain language which accounts dropped below 60 this week and why, and gets an answer drawn from CRM, finance and product data.
- Preparing the action. Drafting the account summary before a renewal call, or listing the open tickets and the last executive contact.
- Pushing updates. Logging a risk flag, creating a task or triggering a save workflow in the CRM, within the person’s permissions and with approval where needed.
Where AI does not belong:
- Choosing the weights and bands. That is a business decision about what you value, and a person must own and be able to explain it.
- Deciding to cut service, change pricing or let a customer go. A human makes these calls, with the full context.
- Reading unreliable data. If the CRM and billing disagree, an AI assistant will present one of them with full confidence. Fix the data before you ask it questions.
- Replacing the conversation. The score tells you who to call. It does not replace the call.
We design these agents with permissions, an approval step and an audit trail, so you can see what was asked, what was changed and by whom. There is more detail on AI agents for Finance, Sales and Customer Success, and on the CSM Portal where Customer Success work can sit.
Privacy and regulation: what to keep in mind
A health score built from usage data tied to named users is, in general terms, processing of personal data, so GDPR applies when your customers’ staff are in the EU. Depending on what you build and how you use it, the EU AI Act and NIS2 may also be relevant to your systems and suppliers. We treat all three as design requirements from the start. Build, pilot and testing run on self-hosted European infrastructure in Germany. None of this is legal advice, and no design choice guarantees compliance. Ask your own counsel or data protection officer how the rules apply to your scoring.
How to roll it out in a growing SaaS company
A practical sequence for the first quarter:
- Name one owner. One person is accountable for the definition, the data and the quarterly check.
- Audit the inputs. For each metric, decide which system is the source of truth and how fresh the field must be.
- Fix the biggest data gaps. Sponsor and champion fields, seat counts and renewal dates usually come first.
- Launch a simple scorecard. Five categories, coarse weights, three bands.
- Attach one action per band. Healthy gets light touch and expansion watch. At risk gets outreach and an adoption plan. Critical gets escalation and a save plan with a deadline.
- Validate after 90 days, then every quarter.
To see what an onboarding-stage version looks like, read our note on onboarding automation for B2B SaaS.
Our perspective
We see health scoring as an operations problem before it is an analytics problem. Teams spend weeks debating whether usage should weigh 30 or 40 percent, while the CRM still lists a sponsor who left a year ago and finance holds a different seat count from the product.
That is why we work in a fixed order. First the data foundation, with CRM and finance data as the source of truth. Then the AI layer, connecting that data to the assistant your company already uses. Then the department agents for Finance, Sales and Customer Success. A health score sits on top of all three, and it is only as good as the bottom layer.
We also think someone has to own it. In many SaaS companies the team uses AI, but nobody decides where it pays and where it does not. A Fractional Chief AI Officer is one named person who makes that call, backed by 25 years of running operations, and builds the working system as well, so strategy and system do not drift apart. We adopt AI one process at a time, starting with the most expensive one. For many companies, churn is on that list.
The client owns what is built: source code, documentation and infrastructure transfer at handover.
Claus Nielsen
How NordOps Consulting can help
If your team has a score nobody trusts, or no score at all, the first step is a clear look at your data and where AI would pay. The AI Readiness Assessment starts from €4,500 and covers exactly that question. For a smaller first step, the AI Snapshot is priced at €2,500 to €3,500, and the 30-minute discovery call is free.
If you want one person to own AI across the company, the Fractional Chief AI Officer retainer starts from €1,500 per month. Builds are priced at 30% of the first-year saving, once measured and proven, or at a fixed price agreed before work starts. You can see the wider picture on our page about AI for B2B SaaS companies in Europe.
FAQ
What is a good customer health score?
It depends on your scale and bands. A common setup is Healthy at 70 to 100, At risk at 40 to 69 and Critical at 0 to 39. The better test is whether accounts in the red band churn more often than the rest. Validate that against your own churned accounts each quarter.
How many metrics should a health score include?
Six to ten is a workable range. Fewer than six leaves blind spots, and more than ten makes it hard to see why a score changed. Cover usage with trend, adoption, support, relationship and commercial signals, and drop any metric that does not move before the outcome.
Is NPS enough to measure customer health?
No. NPS is one sentiment signal, and it is a snapshot from the people who answered. A health score is a composite that combines several data points into a single view. Use NPS as one input next to usage, support, relationship and billing signals.
How does a health score give early warning of churn?
It does so when it contains leading signals and a drop triggers a defined action. Examples are falling usage trend, a departed champion or rising ticket severity. Check the score by looking at what it said 90 days before past churn. If it was green then, the signals are too late.
Can AI calculate the score for us?
AI can pull the data, explain a score change and prepare the follow-up. A person should own the weights, the bands and the decisions. The data must be consistent first, otherwise the answers will be fluent but unreliable.
Sources
- Customer health score: Everything you need to know, HubSpot
- Customer Health Score: Metrics, Template, and How to Build, ZoomInfo Pipeline
- How to build a customer health score, Basedash
- Data Science: Rebuilding Asana’s Account Health Score